1. Introduction
According to Wikipedia, the top 10 companies in the world by market capitalization in the second quarter of 2024 are Apple, Microsoft, NVIDIA, Alphabet, Saudi Aramco, Amazon, Meta Platforms, Berkshire Hathaway, TSMC, and Eli Lilly. Either these companies have some legendary past CEOs like Steve Jobs of Apple and Bill Gates of Microsoft or news media widely follow and report their current CEOs. Some people still credit Apple’s climb to world number 1 in market capitalization to its former CEO Steve Jobs. These are examples of how important a CEO is to the success of a company. It follows that CEO turnover, forced and voluntary, are both very important to a company. So it is interesting both practically and academically to study CEO forced turnovers. We study CEO forced turnover in the context of Securities Class Action Litigations.
The ensuing impact of SCA litigation is rooted in agency problems. CEOs, making investment and financing decisions on behalf of investors, have more insider information in terms of the quality of assets and firm operational alternatives compared to creditors and shareholders, and are assumed to have incentives to take advantage of their private information and extract rent from firms (J. Evans et al., 2014; Laux, 2007). CEOs may manage earnings out of their career concerns (Ali & Zhang, 2015; Cohen et al., 2008; J. H. Evans et al., 2010). Studies show that CEO turnover is preceded by poor financial performance (Brickley, 2003; Coughlan & Schmidt, 1985; Denis & Denis, 1995; Murphy & Zimmerman, 1993). In addition, Warner et al. (1988) show the association between a firm’s stock returns and subsequent top management changes. They present an isenverse relation between the probability of management change and share performance. In other words, CEOs are more likely to be dismissed when stock and accounting performance is poor than when it is good.
Although in the short run, accounting targets can be met and stock prices may be boosted up, building such an illusive image of superior firm performance through overstating earnings cannot eliminate their chance of turnover, for accruals will ultimately reverse. In contrast, earnings management may increase the probability of turnover. Allen, Larson and Sloan (2013) show the negative influence of accrual reversal on future stock prices. Hazarika et al. (2012) indicate that earnings management, as reflected in absolute discretionary accruals, increases the likelihood of forced CEO turnover in the subsequent year. Arthaud-Day et al. (2006) find that CEOs and CFOs of firms filing a material financial restatement are more than twice as likely to be dismissed as their counterparts in a matched sample of control firms. Our result is consistent with the prior literature. By analyzing up to five years before SCA litigation, we demonstrate that SCA firms have significantly higher-than-market stock return, sales growth and earning management, and their higher stock returns are positively associated with accounting performance. However, their accounting performance measured in terms of ROA, ROE and net income per employee fail to follow the higher sales growth, and hence, in the year of SCA litigation, stock return of SCA firms collapses, which gives rise to the much higher CEO turnover of SCA firms.
The fraud/lawsuit revelations following earnings management are found to be positively related to CEO turnover and have a negative influence on stock prices (Aharony et al., 2015; Hennes et al., 2008; Persons, 2006). This is supported by our evidence that SCA firms are four times as likely to fire their CEOs as Non-SCA firms. In order to repair the firm reputation, the boards tend to make forced CEO turnover decisions. It is shown that forced resignations of top managers are preceded by large and significant declines in operating performance and followed by large improvements in performance (Denis & Denis, 1995). Hazarika, Karpoff and Nahata (2012) argue that it is highly probable that the boards proactively monitor managers’ earnings management and take actions before the overly aggressive behavior are known publicly. They find that the degree of earnings management is positively related to the probability of forced CEO turnover, and this relation is invariant of firm performance and the direction of accruals and conclude that the overly aggressive earnings management behavior of CEOs can lead to CEO turnover before being detected externally.
Our study makes several contributions. First, we contribute to the literature on the factors influencing forced CEO turnover probability. To our best knowledge, our paper is the first one to point out that CEOs of corporations are more likely to be forced out due to the SCA litigation. The results are robust as we utilize both Cox Proportional Hazard and Logistic models to study such multivariate relationships. We observe that the various firm performances surrounding the SCA litigation are different and unsustainable. Additionally, this study further contributes to the empirical fact that CEOs lose their positions due to the manipulation of accounting records.
Second, we enrich the literature on SCA litigation in the field of corporate governance. Previous literature considers how the SCA litigation affects the firms’ decision-making in terms of investment (e.g., overinvestment activities) (McTier & Wald, 2011) as well as the financing choices (e.g., leverage) (Arena & Julio, 2015). Our study points out another fields significant decisions for corporate boards: whether to fire a CEO when there is a SCA lawsuit, further providing practical implications in the process of corporate operation.
2. Literature Review and Hypothesis Development
2.1. Literature Review: Consequences of SCA Litigation
In the United States, under the Securities Act of 1933 and the Securities Exchange Act of 1934, all listed firms are exposed to SCA litigation risks. Prior literature discusses the consequences of SCA litigation from two perspectives. First, it is the inevitable monetary damage that SCA firms will face. For one thing, punished firms are confronted with the direct negative impact of accounting punishments, such as decreasing shareholder wealth (Wang et al., 2019) and poor stock return (Yuan & Zhang, 2016). For another, deeper adverse influences exist in terms of firms’ liquidity and investment choices. It is observed that punished firms prefer to accumulate cash and reduce capital expenditure in order to respond to the subsequent risks and conditions induced by litigation (Arena & Julio, 2015). The market quality is also affected, presented as the improved stock price volatility, the wider spread, as well as the increased liquidity (Morris et al., 2019).
Second, non-monetary harms such as poor reputation and poor trust cannot be ignored for SCA firms. Literature has discussed that due to the bankruptcy of reputation, SCA firms face difficulties, including product market and customer sanctions (Johnson et al., 2014), media coverage with more negative tones (Donelson et al., 2024), and greater public attention on accounting improprieties (Simmons, 2011). Thus, monitoring costs such as audit fees (Eisenberg & Miller, 2004) and legal expenditures such as attorney fees (Eisenberg & Miller, 2010) tend to be more expensive once a firm commits corporate fraud. Additionally, in terms of corporate governance, the SCA litigation also accelerates the directors’ turnover likelihood, especially for directors who hold greater stock ownership and who are with multiple directorships at other firms (Gao et al., 2017). We, based on this paper, explore deeply how one of the key executives, the CEO, is influenced by SCA litigation and explore the potential reasons.
2.2. Hypothesis Development
A CEO has a central role in both the daily management of a company and possibly in the future direction of a company. We develop below our hypotheses in CEO forced turnover:
H1: SCA firms have significantly higher CEO forced turnover ratios than Non-SCA firms and these higher CEO forced turnovers are positively and significantly related to lower stock return, higher earning management and lower profits.
H2: CEOs of SCA firms try to manipulate earnings and sales growth in order to push up stock return and this manipulation is successful before the year of filing of SCA lawsuits.
3. Data, Measures and Methodology
We collect CEO turnover data from Compustat ExecuComp and group turnovers into forced turnover and voluntary turnover according to Parrino (1997). We then combine CEO turnover data with return data from CRSP, accounting performance data from Compustat and SCA data from Stanford University Law School Security Class Action Clearinghouse. Totally, there are 1538 CEO turnovers between 1997 and 2012[1], of which 369 are identified as forced turnover and 1169 are identified as voluntary turnover (see Table 1 Panel A). Table 1 Panel A also shows that forced turnover ratio is 0.032, voluntary turnover ratio is 0.101, and the total turnover ratio is 0.133, which are consistent with the literature, e.g., see Jenter and Kanaan (2015) and Lee, Matsunaga and Park (2012).
Table 1 Panel B shows the summary statistics for financial performance, accounting performance, earning management and other control variables in year -1[2]. For financial performance, in addition to unadjusted stock return we include industry adjusted stock return, stock return bottom decile dummy, stock return momentum loser and winner dummies. Jenter and Kanaan (2015) discuss why the Strong-form relative performance test is preferred over the Weak-form test, though we provide both the Weak-form and Strong-firm tests in this paper. To do the Strong-form relative performance test, we need a two-stage regression approach. Following Jenter and Kanaan (2015), in the first stage, we derive industry-adjusted stock return:
First Stage: rj,Y−1=α0+α1rindustry group, Y−1+uj,Y−1
Where r j,Y-1 is unadjusted annual stock return of firm j at year Y-1 (Y=1996 to 2012), r ~industry group, Y-1~ is mean unadjusted annual stock return of industry groups[3] at year Y-1 and uj,Y-1, the residual, is industry adjusted annual stock return of firm j at year Y-1.
Second Stage: Prob (CEO forced turnover)Y,j,t=β0,t+β1,tuY−1,j,t+β2,t∗other variablesY−1,j,t+vY,j,t
Where Y=1996 to 2012, t= -5 to +5 and t=0 denotes year of filing of lawsuit.
u Y,j,t-1, the residual in equation (1) is the industry adjusted annual stock return. Instead of following Jenter and Kanaan (2015) in including the estimated exogenous component of firm performance in equation (2), we put the annual stock return bottom decile dummy, the momentum loser and winner dummies in equation 2. In each year, we divide all stock available in CRSP by unadjusted annual stock return into 3 groups. If a stock’s unadjusted annual stock return is in the bottom decile, then it has an annual stock return bottom decile dummy of 1, otherwise 0. This decile dummy shows the relative performance of a stock to the market. Similarly, for every year, we divided all stocks in CRSP in year -2 (2 year before) into three groups by unadjusted annual stock return. For stocks in the bottom 1/3, we further divide them into three groups by unadjusted annual stock return in year -1. For stocks in the bottom 1/3 in both years -1 and -2, we call them unadjusted annual stock return momentum losers and they have an unadjusted annual stock return momentum loser dummy of 1, otherwise 0. Similarly, for stocks in the top 1/3 in both years -1 and -2, we call them unadjusted annual stock return momentum winners and they have an unadjusted annual stock return momentum winner dummy of 1, otherwise 0. The momentum loser and winner dummies show the relative performance of a stock in two consecutive years and reveal the relative performance of a stock in a dynamic fashion.
One of the most important variables in equation (2) is earning management. To be consistent with Jenter and Kanaan (2015), earning management needs to be industry adjusted too. For this industry adjustment requirement, we follow Hazarika et al. (2012) in obtaining the earning management variable for each of the GICS industry groups:
Total accrualj,Y = (ΔCAj,Y−ΔCLj,Y−ΔCashj,Y−ΔCAj,Y+ΔSTDEBTj,Y−DEPNj,Y)/Assetj,Y−1
Where Y=1996 to 2012, ΔCAj,Y = change in firm assets for firm j from year Y-1 to year Y, ΔCL j,Y = change in firm current liabilities for firm j from year Y-1 to year Y, ΔCA j,Y = change in firm assets for firm j from year Y-1 to year Y, ΔCash j,Y = change in firm cash for firm j from year Y-1 to year Y, ΔSTDEBT j,Y = change in firm debt in current liabilities for firm j from year Y-1 to year Y, DEPN j,Y = change in firm depreciation and amortization for firm j from year Y-1 to year Y and Asset j,Y = book value of asset for firm j from in year Y.
The abnormal accrual of firm j in year Y is obtained from the residual in the following equation:
Total accrualj,Y= β0j+β1j(1/Assetj,Y−1)+β2j(ΔRevj,Y−ΔARj,Y)+β3j(PPEj,Y)+β4j(ROAj,Y−1)+wj,Y
Where ΔRevj,Y = change in revenue for firm j from year Y-1 to year Y divided by Assetj,Y-1, ΔARj,Y= change in account receivables for firm j from year Y-1 to year t divided by Assetj,Y-1, PPEj,Y= gross value of property, plant and equipment for firm j in year Y divided by Assetj,Y-1,
and ROAj,Y-1= return on asset for firm j in year Y-1 to year Y. Earning management of firm j in year Y is the absolute value of wj,Y.
For accounting performance measures, we include ROA[4] and sales growth. ROA is net income / total asset and sales growth is sales at year Y/sales at year Y-1. Unadjusted ROA and sales growth can be unreliable with extreme values and to be consistent with our earning management variable, ROA and sales growth are also winsorized at 5% and 95% for each industry[5]. The other variables are:
Inventory to cost of goods sold ratio (= (inventory/(cost of goods sold/365))/1000) receivable to sales ratio (= (account receivable / (sales/365))/1000)
Current ratio = (current asset/current liabilities)
Debt ratio = (total liabilities / total assets)
and age of CEO, tenure in years of CEO and size (natural log of total assets).
All of the variables in Table 1 Panel B have a total number of observations of 11537, except for CEO tenure, which has only 11526 observations. Annual unadjusted stock return shows large variation from -97% to 2619%, with a mean of 15% and a median of 9%. The age of the CEO is from a minimum of 32 years to a maximum of 96 years, while CEO tenure (= number of days as CEO/365) is from 0 years (i.e., CEO tenure is less than 4 days) to 12.71 years with a mean of 7.29 years and a median of 5.25 years. ROA is from -185% to 53%, with a mean of 5% and a median of also 5%.
In each year, we divide all stocks (a total of 11537) into two groups. First, if a company has an SCA litigation in a year, we label this company as an SCA firm. Second, the remaining firms in the same year are in the ‘Non-SCA’ group. Table 1 Panel C shows the number of SCA firms and Non-SCA firms each year in year 0 (year of filing of lawsuit reported in SCA litigation database is denoted year 0)[6]. The total number of SCA firms and Non-SCA firms are 345 and 11192 respectively. Each group has a large enough sample size for Cox proportional hazard rate and logistic analysis later on.
In Table 1 Panel C, we show the number of observations, mean, minimum and maximum of unadjusted stock return, industry adjusted stock return, earning management, ROA, sales growth in year -1 and forced turnover ratios for SCA and Non-SCA firms in SCA filing year (year 0). In year 0, we need to regress year -1 accounting and financial performance variables, earning management, and other control variables on the year 0 CEO forced turnover dummy. 345 SCA filings are included in our study. The mean turnover ratio for SCA firms is 11.6%, much higher than of Non-SCA firms (2.9%).
4. Univariate Analysis
4.1. SCA firms have significantly higher CEO turnover ratios than that of Non-SCA firms and this is highly related to earning management and unsustainable sales growth
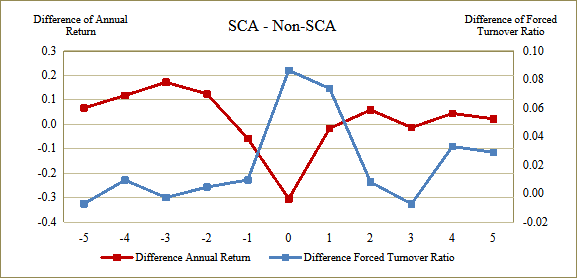
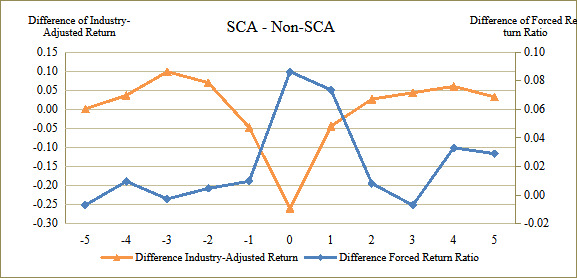
Figure 1 shows graphically the difference in CEO forced turnover ratios between SCA and Non-SCA forms with accounting and financial performance variables, and the results are striking. Figure 1 Panel A shows that the unadjusted annual return of SCA firms is around 30 percentage points lower than that of Non-SCA firms in year 0, while the CEO forced turnover ratio of SCA firms is three times higher than that of Non-SCA firms in the same year. The difference in annual return (SCA minus Non-SCA) is largely a “V-shape” curse and bottoms at year 0, and the difference of CEO forced turnover ratio (SCA minus Non-SCA) is largely in inverted “V-shape” curse and peaks at the same year. The fact that they both bottom and peak in the same year (year 0) shows the close relationship between CEO forced turnover and financial performance. The fact that the stock return of SCA firms is substantially (I shall show below the difference is also statistically significant) higher than that of Non-SCA firms before year 0 and CEO forced turnover of SCA firms is substantially below that of Non-SCA firms further supports the hypothesis that CEO forced turnover is closely related to financial performance.

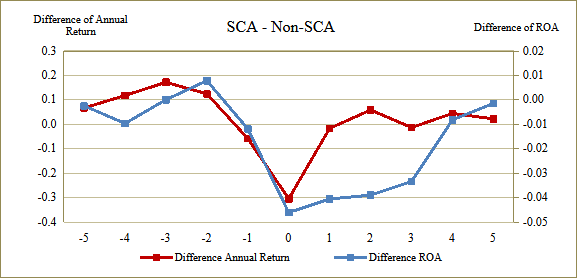
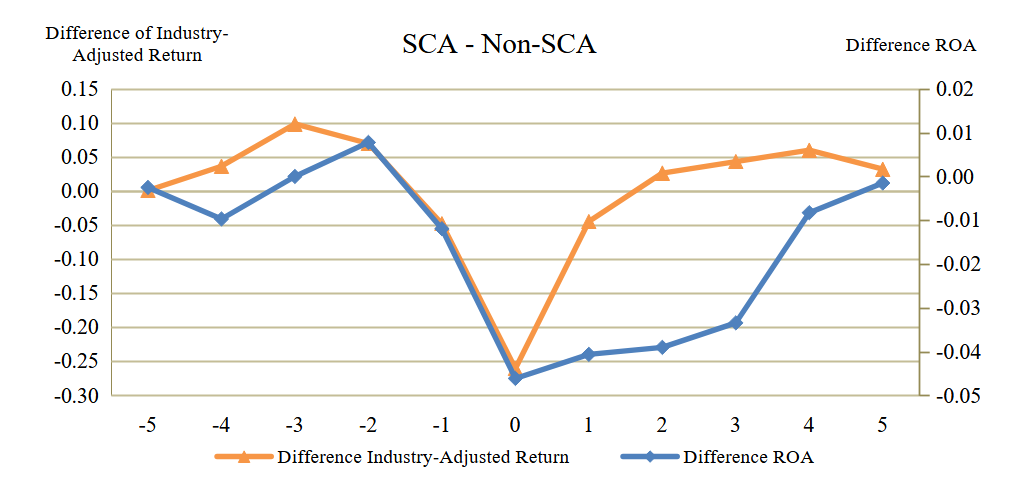
Figure 1 Panel B shows the relationship between the difference in unadjusted annual return of SCA firms and Non-SCA firms and the difference in ROA. Both are “V-shaped curve” and both bottoms at year 0. In year 0, the ROA of SCA firms is close to 5 percentage points below that of Non-SCA firms, and this difference is huge. Figure 1 Panel B shows that financial performance is closely related to accounting performance, supporting the argument that the market is efficient.

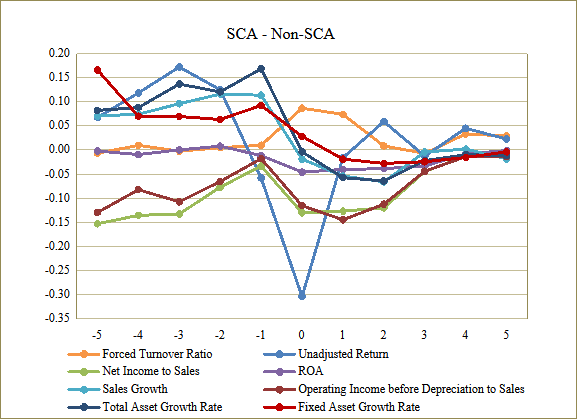
Figure 1 Panel C shows the difference of CEO forced turnover ratios between SCA and Non-SCA forms with several accounting and financial performance variables: net income to sales ratio, total assets growth ratio, unadjusted annual return, ROA, operating income before depreciation to sales and total property plant and equipment growth rate. Except for the difference of CEO forced turnover ratio, which is “V-shaped,” the other financial and accounting performance variables are “Inverted V-shaped,” bottoming at or around year 0. This panel shows the close relationship between the CEO forced turnover ratio and financial and accounting performance ratios.
._difference_of_mean_unadjusted_annual_return_vs_difference_of_accounting_.png)
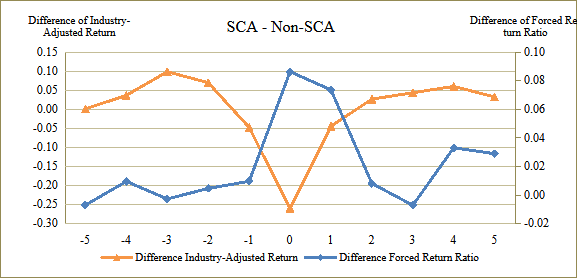
Similar to Figure 1 Panel A, Figure 1 Panel D shows the relationship between the difference in adjusted return and the difference in CEO forced turnover ratio. The results are also similar. Both differences either bottom or peak in the same year (year 0) and industry adjusted return of SCA firms are around 27 percentage points lower than that of Non-SCA firms, a huge difference. Again I shall show below that this difference is statistically significant at a t-stat of 11.29, significant at 1% confidence interval. So it means whether we use unadjusted or industry return, there is a close relationship between CEO forced turnover ratio and financial performance.
Finally, Figure 1 Panel E shows the relationship between the difference of industry adjusted return and the difference of ROA. Similar to Figure 1 Panel B, both are “V” shaped and bottoms at the same year (year 0). Again this show the close relationship between financial and accounting performance ratios, irrespective of whether adjusted or unadjusted annual return are used.

Figure 1 shows the close relationship between CEO turnover ratio and accounting and financial performance variables, but I do not discuss statistical significance. Table 2 Panel A presents the mean forced turnover ratio[7] and other firm performance ratios for SCA and Non-SCA stocks with statistical significance. Due to space limitation, we only show years -5, -2, -1, 0, 1, 2 and 5.[8] Five years before the SCA lawsuit, the mean forced turnover ratio of SCA and Non-SCA groups are 0.021 and 0.028 respectively (t=0.81 for Non-SCA minus SCA, hereafter Non - SCA), i.e., Non-SCA firms have higher CEO turnover ratio, though statistically no significant. When time gets closer to SCA year (the year of the filing of lawsuits), the mean forced turnover ratio of SCA firms starts to be higher than the corresponding mean of Non-SCA firms, which may be a result of information leak, but the difference is still insignificant. In the year of SCA litigation, the mean difference of CEO forced turnover ratio increased sharply. The mean forced turnover ratio of SCA stocks becomes as high as 0.116, whereas that of Non-SCA related stocks is only 0.029 (t stat for the difference= -4.99, significant at 1%). The mean forced turnover ratio of SCA is around 300% higher than that of Non-SCA firms, where the difference is notably significantly negative. Moreover, the mean forced turnover ratio of SCA stocks continues to be substantially higher than of Non-SCA firms for the next 2 years. Hence, these results, from both mean difference magnitude and significance, show that SCA litigation is deadly to CEO. When there is a SCA litigation, the CEO of a company is significantly more likely to be kicked out than those in Non-SCA companies, and this trend persists for five years after the lawsuit.
Table 2 Panel A also presents the mean of firm performance and other ratios. First, the mean unadjusted annual return of SCA is higher than that of Non-SCA firms in years -5 and -2 (significant at year -2) but then becomes significantly lower than that of Non-SCA firms in years -1 and 0. In year 0, the mean unadjusted return of SCA firms is 30.4 percentage points lower (and also significant at 1%) than that of Non-SCA firms, a highly significant difference. Figure 1 Panel A denotes this graphically, and from the figure, we can notice that the difference in forced turnover ratio (SCA minus Non-SCA) peaks in year 0, while the difference of unadjusted return (SCA minus Non-SCA) reaches the bottom in the same year.
4.2. High Sales and Asset growth of SCA firms are not sustainable
We show below that this peak and bottom relationship is not a coincidence. SCA firms have substantially higher unadjusted stock returns than non-SCA firms from years -5 to -2. From Table 2 Panel A, we also observe that the mean of earning management of SCA firms is significantly higher than that of Non-SCA firms in all years. Moreover, the mean sales growth of SCA firms is significantly above that of Non-SCA firms from years -5 to -1. Interestingly, the mean sales growth of SCA firms is insignificantly below that of Non-SCA firms in year 0 and significantly below that of Non-SCA firms in years 1 and 2. The bottom line of a firm’s management is profit. In all years except year -2, the mean ROA of SCA firms is below that of Non-SCA firms, and the difference is significant in years 0, 1, and 2. Coupled with the collapse of SCA firms’ returns in year 0, compared with that of Non-SCA firms, a reasonable hypothesis to explain this collapse in return is that CEOs of SCA firms try to manipulate stock return by high earning management and high sales and asset growth. This is successful in the early year before year 0, as suggested by the higher unadjusted stock return of non-SCA firms up to year -2. However, this manipulation is not sustainable because profit as measured by ROA of SCA firms is below that of Non-SCA firms in all but year -2, and the mean ROA of SCA firms is even negative in year 0 as compared with a positive 5.5% for Non-SCA firms. The inferior performance of SCA firms in ROA is the major reason that leads to a collapse of stock return of SCA firms in year 0. This relationship is shown graphically in Figure 1 Panel B. Figure 1 Panel B clearly shows that the difference of unadjusted stock return basically moves in unison with that of ROA. Both reach the bottom in year 0. This collapse in stock return of SCA firms would then lead to a significantly higher CEO forced turnover ratio for SCA firms.
4.3. Sales not generating profit for SCA firms
But why is ROA not following the substantially higher sales growth for SCA firms? From Table 2, Panel B, we can see that sales growth, total asset growth rate and property, plant and equipment growth rate of SCA firms are substantially higher than that of Non-SCA firms before year 0, while ROA, operating profit to sales ratio and net income to sales ratio of SCA firms are basically lower before and including year 0. The relationship is also shown graphically in Figure 1 Panel C.
In Figure 1 Panel C, most if not all of the differences of mean measure reach bottom at year 0 and become negative. Both operating profit to sales ratio and net income to sales ratio are negative for all years. For SCA firms, a negative operating profit-to-sales ratio means that the firms sacrifice profit for higher sales growth. The negative net income to sales ratio clearly demonstrates that for SCA firms, sales generate lower profit than Non-SCA firms. From Table 1 Panel A, the net income to sales ratio of SCA firms, without looking at the difference, is negative in all years except year 5. This negative net income to sales ratio is better than ROA in showing that SCA firms sacrifice profits for sales growth and this leads to the collapse of the stock return in year 0 for SCA firms.
5. Regression Analysis
5.1 Strong-form relative performance test
To do the strong-form relative performance test, we first used equation 1 to do the first-stage test to derive the industry adjusted values for stock return and other measures. Results are in Table 3 Panel A. Consistent with Jenter and Fanaan (2015), the parameter for the industry mean is 1.00 but our adjusted R2 is much higher than theirs.
Table 3 Panel B presents the results of the second-stage Cox proportional hazard regression of forced CEO turnover on industry-adjusted stock return and other industry-adjusted ratios. This is one of the first papers in accounting literature that employ Cox proportional hazard regression. According to some literature, such as Jenter and Fanaan (2015), Cox proportional hazard regression is preferred to Logistics regression because Cox proportional hazard regression includes CEO tenure as the dependent variable. However, we also include Logistic regression in my study. The dependent variable is the CEO forced turnover dummy at year t where t= -5 to +5 and t=0 means the year of the filing of a lawsuit. The independent variables are values of 1 year before the dependent variable except for the SCA dummies, which always have values of t=0. I provide Chi square statistics.
Consistent with univariate results in section four, SCA dummies are positive and significant at t=0 and 1, i.e., SCA firms have significantly higher forced CEO turnover than Non-SCA firms in the year of the filing of a lawsuit and also in 1 year after the filing. This further supports our hypothesis in a multivariate setting. Our hypothesis H1 is that SCA firms have significantly higher CEO forced turnovers than Non-SCA firms. We include four measures in financial performance: industry adjusted stock return, industry adjusted bottom decile dummy, industry adjusted momentum loser dummy and industry adjusted momentum winner dummy. Industry adjusted stock return is negative and significant at 1% in all years which is consistent with the literature. This illustrates that one of the top concerns, if not the top concern, for the board of directors in deciding CEO turnover, is a stock return. This is obvious because a top objective for investors for investing in a company is stock return. Higher stock return usually implies shareholders are more satisfied, which in turn puts less pressure on the board to remove the CEO. The bottom decile dummy, which shows whether the company’s stock return is in the bottom 1/10 of all stocks available in CRSP is not significant in any year. We follow Jenter and Kanaan (2015) in providing the momentum loser and winner measures.[9] The momentum loser dummy, which shows whether a company’s stock return is consistently in the bottom 1/3 of all stocks in CRSP both in the previous 1 and 2 years before t, is positive and significant in all years except -5. The momentum winner dummy, which shows whether a company’s stock return is consistently in the top 1/3 of all stocks in CRSP both in the previous 1 and 2 years before t, is not significant in any year. These three measures are complementary to the stock return measure because they measure the relative performance of a company’s return to the market. When we compare the bottom decile dummy with the momentum loser dummy, we find that the board of directors is more concerned if a company’s stock return was consistently in the bottom 1/3 in both the previous 1 and 2 years than whether the stock’s return is in the bottom 1/10 in the past 1 year. This implies that the board is more concerned about the consistent performance of a company in stock return than whether the company is doing very poorly in a particular year. If we compare the momentum loser dummy with the momentum winner dummy, the insignificance of the momentum winner results show that when considering to force a CEO out, consistent poor performance of a company is more important than consistent good performance.
For accounting performance, we include industry adjusted ROA and industry adjusted sales growth. Both are negative and significant at 1% in all but one year, especially in year 0. Our results show that the board of directors, in deciding whether to force a CEO out, is very interested in the measure of ROA and sales growth. ROA and sales growth are major drivers of a company’s stock return as ROA is a measure of the profitability of a company and sales growth is one of the factors that will determine whether a company’s profit is sustainable. Our results show that when a company’s ROA and sales growth are good, it is less likely that the CEO will be forced out.
Our earning management variable shows that it is negative but not significant before t=0. It is positive starting from year 0 until year 5 but is only significant at year 0. It seems that the board of directors accepts the earning management of the company’s CEO before year 0. But earning management is not sustainable, as can be seen from the deteriorating stock return, ROA, and net income to sales of both SCA firms relative to Non-SCA firms in Table 2, though sales growth of both SCA firms is consistently above that of Non-SCA firms before year 0. Our results show that a firm’s CEO, through manipulating the earning management and sales growth measures, may be able to fool both the board of directors, shareholders and the market for a few years, but in year 0, when the company is being sued, stock return collapses. This leads to higher CEO forced turnover for SCA firms as they have higher earning management than Non-SCA firms in year 0.
In summary, first, it indicates that SCA lawsuits are lethal to CEOs in SCA firms. In year 0, dummy variables are highly significant and positive, supporting the univariate analysis that CEOs in SCA companies are more likely to be fired than Non-SCA firms. This relationship extends into year 1. The parameter estimate of SCA dummy is 1.239 (t stat=52.09) at year 0 which is extremely high. Second, it shows the importance of previous stock performance in CEO forced turnover decision (Table 3). It shows that good (poor) past performance leads to the increase (decrease) of the probability of the CEO being fired.
For robustness test, we also regress CEO forced turnover on market adjusted variables in Table 4. The results are basically consistent with Table 3 and this implies that our results are very robust and they are independent of the choice of variables.
I also have done robustness check by using logistic regression and by replacing control variables. All results show that SCA litigation increases the risk of CEO being fired. SCA dummy are significantly and positively related to forced turnover dummy, and the relation is the highest at the SCA year. Notice that different from Cox proportional hazard model, CEO tenure is one of the independent variables.
6. Conclusion
We are the first paper in the literature that shows CEO forced turnover of firms that have SCA litigation is four times as much as ( more than 300%) the Non-SCA firms in the year of SCA litigations and this could be explained by greater earning management and unsustainable sales growth. Specifically, up to five years before SCA litigation, SCA firms have significantly higher stock return, sales growth and earnings management than the Non-SCA firms and we show that the higher stock returns are positively correlated with accounting performance and earning management. Accounting performance measured in terms of ROA and net income to sales fail to follow the higher sales growth and in the year of SCA litigation, stock return of SCA firms collapses and this is the reason for the much higher CEO forced turnover of SCA firms. Additionally, this is also one of the first papers in accounting literature to use both Cox Proportional Hazard and Logistic models to study the multivariate relationship between CEO forced turnover and accounting and financial performance, earning management and other control variables.