


With the steady development of the social economy, the manufacturing industry, as the main body of the real economy, its high-quality development contributes to the comprehensive strength (Liu, 2023). Over the past few years, the Chinese government has been committed to promoting the high-quality development of the manufacturing industry through industrial integration. It was mentioned in the “Made in China 2025” that China should accelerate the synergistic development of the manufacturing and service industries and transform production-based manufacturing into service-based manufacturing. In 2019, the outline development plan for the GBA also focused on promoting the integration of the manufacturing industry with the productive service industry to build a modern industrial system with international competitiveness, as unveiled by the Chinese authorities. As an important part of the productive service industry, the logistics industry has a close relationship with the manufacturing industry in the value chain (Chen, 2023). The logistics industry itself is divested from the manufacturing industry and has a natural industrial correlation with the manufacturing industry, which indicates that the balanced development of the integration of the logistics industry and the manufacturing industry is the key to the high-quality development of the manufacturing industry. In 2020, the National Development and Reform Commission issued the “Implementation Plan for Promoting Deep Integration and Innovative Development of the Manufacturing Industry of the Logistics Sector”, which proposed to strengthen the role of the logistics industry in promoting the high-quality development of the traditional manufacturing industry, etc.
Against the background of promoting high-quality development of the modern manufacturing in the GBA, this study aimed to explore the comprehensive index of manufacturing from 2008-2022. Besides, this paper focused on the development of the coupling between the logistics industry and the manufacturing industry in the GBA from 2008-2022. Taking 11 cities in the GBA as case studies, adopting the modified entropy model, and the coupling coordination degree model, this study measured the comprehensive index of manufacturing of cities in the GBA from 2008 to 2022 and analyzed the spatial and temporal characteristics and mechanism of the CCDs of cities in the PRD. By examining these issues, this paper hopes to help provide theoretical references for government decision-making.
Literature Review
The relevant literature on the industrial integration of manufacturing and logistics has focused on their interrelationships and the measurement and evaluation of their degree of coordination. Discussion on their interrelationships began in the 1970s, and research to date has mainly formed three perspectives: hypothesis of demand-following, hypothesis of supply-leading, and hypothesis of interaction. The hypothesis of demand-following holds that manufacturing holds a dominant position in the relationship between the producer services industry and the manufacturing industry.
Guerrieri and Meliciani emphasized that the productive service sectors are in a demand-following position and act as an adjunct and complement to manufacturing (Guerrieri & Meliciani, 2005). Wang suggested that the coordinated development between manufacturing and logistics is a form of collaboration based on logistics outsourcing, serving as a service procurement activity for manufacturing enterprises (Z. Wang, 2009). Conversely, the hypothesis of supply-leading argues that the logistics industry is a prerequisite for the development of manufacturing. Productive service sectors have a significant positive impact on the production efficiency of manufacturing. The productive service sectors can enhance the internal division of labor in manufacturing, thus improving productivity (Tanaka, 2009). Scholars like Daniels and Coffey, who advocated the hypothesis of interaction, viewed manufacturing and logistics as having a complementary relationship characterized by interconnected development and interactive effects (Coffey, 1996; Daniels, 1985). Lundvall argued that the integration of the two industries strengthens their development and promotes economic growth (Lundvall & Borrás, 1998). Deng noted a strong industrial correlation between the two sectors, arguing that their coordinated development is an effective pathway to mutual benefit and an effective industrial strategy during economic transition, while also pointing out the inadequacies in their coordination (Deng, 2013). When it comes to the measurement and evaluation of their degree of coordination., there are few direct studies abroad on the relationship between manufacturing and logistics. More often, studies focus on the interaction between manufacturing and the productive service sectors. For instance, Czarnitzki and Ebersberger applied the input-output method to analyze the intermediate inputs of manufacturing in different countries, finding that increases in high-tech inputs in manufacturing promote the development of productive services (Czarnitzki & Ebersberger, 2010).
Chinese research in this area was more abundant. Xu and Ran have used the coupling coordination degree model to test factors related to the coordinated development of these two industries (Ran, 2020; Xu, 2021). Shi and Zhao used the DEA (Data Envelopment Analysis) method to measure the coordination between the logistics and manufacturing industries in Jiangsu Province from 1998 to 2007 (Shi & Zhao, 2010). Gu studied the degree of coordination development between manufacturing and logistics in the PRD region, focusing primarily on the development trends of the gross production values of manufacturing and logistics, and then used stationarity tests, cointegration tests, and Granger causality tests to comprehensively examine the interaction between the two industries (Gu, 2015). Gong and Wang used Chinese data from 2003-2013 to develop a GRNN model, selecting indicators such as industrial input levels, development scale, and output efficiency to analyze the development trends and coordination between state-owned manufacturing and logistics (X. W. Gong & Wang, 2016). Du and Yang employed the Haken model in an empirical analysis that showed a high overall coordination level between logistics and manufacturing in the Yangtze River Economic Belt, and that the development of manufacturing could effectively promote the coordinated evolution of logistics and manufacturing (W. Du & Yang, 2022). Gong and Jing used the data from 30 provinces in China (excluding Tibet, Hong Kong, Macau, and Taiwan) from 2009 to 2022 and employed fixed-effects and random-effects regression models to investigate the impact of the “two industries” coupling and coordination on the level of high-quality development in manufacturing (X. Gong & Jing, 2022).
For the study of industrial coordination between the logistics industry and the manufacturing industry, scholars’ empirical research has become more and more diversified in terms of measurement, and the perspectives of exploring the relationship between the two industries have also been evolving. In a comprehensive view, research on high-quality industrial development and the CCD have been gradually enriched, but there are still some shortcomings that need to be addressed. Firstly, Previous literature on industrial synergy has predominantly focused on single indicators, such as employment population and total output value. However, high-quality development necessitates measurement through a multi-indicator system. Secondly, Few scholars have analyzed the industry connections between the industries in Hong Kong and Macau and those in the mainland. Scholars usually exclude Hong Kong and Macau in their research. Therefore, this study focused on the Greater Bay Area as its research region. Based on actual statistical data, this study constructed three coupling coordination models for evaluating the coordination between industries, aiming to fill a gap in regional empirical research.
Research Methods, Data Sources, and the Indication System
3.1. Research Methods
In this context, the different years are denoted as and the selected indicators are denoted as The attribute value of the indicator in the year is then denoted as Because different dimensions that exist among different indicators are not comparable with each other. Standardization of the indicator data is required.
The Modified Entropy Method
Step 1:
Conduct the data normalization process
if is a positive indicator:
yij=xij−xmin′xmax′−xmin′
if is a negative indicator:
yij=xmax′−xijxmax′−xmin′
Where and are the maximum and minimum values treated as 1% reduction and 1% expansion, respectively, of indicator in all years.
Step 2:
is calculated by the following equation:
pij=yij∑mj=1yij
Where is the specific gravity value for each
Step 3:
The equation for calculating the index entropy is expressed as follows:
ej=−1lnnn∑i=1pijln(pij)
Step 4:
is calculated by the following equation:
gj=1−ej
Step 5:
The equation for calculating the weight of indexes is expressed as follows:
wj=gj∑mj=1gj
The range of is [0,1].
Step 6:
A comprehensive index to assess the level of development of an industry is calculated as follows:
Ui=m∑j=1wjyij
The range of is [0,1]. The larger the index is, the higher the development level of the industry.
Coupling Coordination Degree Model
Coupling is a physics concept that refers to the phenomenon of synergy between two or more systems through mutual movement, interaction, and mutual influence on each other to ultimately realize synergy (X. H. Du & Zhang, 2015). Reference relevant studies (Wang, Kong & Reng, 2021), the following coupled coordination model is used in this paper:
C=2√U1U2U1+U2
T=αU1+βU2
D=√C×T
Where is the coupling degree, whilst and are the comprehensive index of the high-quality development of modern manufacturing and logistics systems, respectively. represents the comprehensive coordination index. and is the coefficient to be determined, represents the coupling coordination degree.
Referring to previous studies (Mou, Wang, X.R. & Wang, C.X., 2022), we divided into ten different levels. (Table 1)
3.2. Data Sources
With the gradual opening up of China’s inland regions, the manufacturing industries of Hong Kong and Macau have progressively relocated to the Pearl River Delta area, initiating a “front shop, back factory” industrial synergy model. In this model, product research and development, design, sales, and logistics are primarily concentrated in Hong Kong and Macau, while the manufacturing of products is carried out in the Pearl River Delta. Following the financial crisis, the Pearl River Delta region has also placed greater emphasis on the high-quality development of manufacturing and industrial synergy among regions. Therefore, based on data availability, the authors analyzed the synergistic evolution and mechanisms of high-quality development in the manufacturing and producer services industries within the Guangdong-Hong Kong-Macao Greater Bay Area between 2008 to 2020. The data in this study originated from the Guangdong Statistical Yearbook, Guangdong Statistical Yearbook of Industry, Hong Kong Annual Digest of Statistics, Macau Yearbook of Statistics, as well as the yearbook data of the nine cities in the PRD. This study adopted data interpolation to address missing values that exist in the data.
3.3. The Indicator System
The selection of industry evaluation indexes usually includes economic, scale, development capacity, and other dimensions (X. E. Wang & Wang, 2023). This study, based on scientific, availability, and comprehensiveness, selected indicators that can significantly reflect the characteristics and evolution process of the high-quality development of modern manufacturing industry system and logistics industry system. Scale, business capability, development capacity, and green energy saving were chosen to reflect the characteristics of systems. Indicators of the three systems are shown in Table 2, Table 3, and Table 4, respectively.
Results and Analysis
4.1. Analysis of the Comprehensive Index of Manufacturing

The comprehensive index of manufacturing was calculated based on equation (1)-(7), as shown in Fig.1. From 2008 to 2022, the comprehensive index of manufacturing has shown a fluctuating upward trend. The development of the comprehensive index of manufacturing has gone through the following stages. For 2008-2012, the comprehensive index of manufacturing jumped from the initial 0.18 to the stage high of 0.37 in 2010, and then showed a downward trend in the following two years, with the comprehensive index of manufacturing dropping back to 0.26 in 2012. For 2012-2013, the comprehensive index of manufacturing stopped declining and rebounded, exceeding the stage high of 0.39 in 2010. Subsequently, the comprehensive index of manufacturing oscillated upward, and the index reached 0.82 as of 2022. It indicates that the high-quality development of the modern manufacturing industry has been improving in the past 15 years, and it has already achieved some development results.
4.2. Spatial and Temporal Characteristics of the Coupling Coordination Degrees
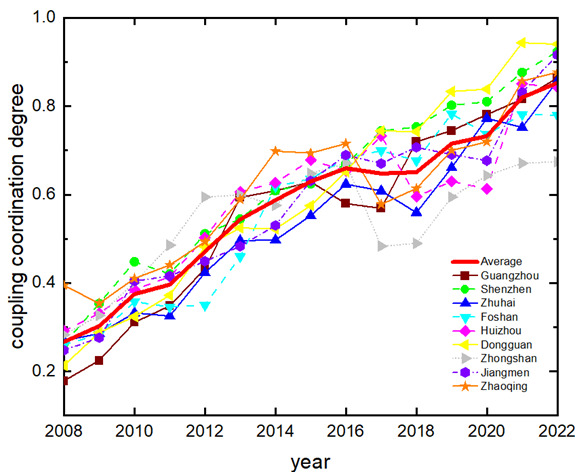
As can be seen in Fig.2, the CCDs between the logistics industry and the manufacturing industry of cities in the PRD in the period 2008-2022 show a slow upward trend. In the past 15 years, important progress has been made in addressing and promoting the synergy between the logistics industry and the manufacturing industry in this period.
From a broad perspective, there were three distinct phases in the temporal pattern of the average value of the CCDs between the logistics industry and the manufacturing industry of cities in the PRD. For 2008-2016, the average value of the CCDs has shown an obvious upward trend, and the average coupling of the two industries in the 9 cities rose from 0.27 in 2008 to 0.66 in 2016, with an average annual increase of 30.6%. In this phase, there were differences in the CCDs between different cities, the difference was always fluctuating within a relatively stable interval. For 2016-2018, changes in the average value of the CCDs have gradually leveled off, with the average value of the CCDs fluctuating from 0.65 to 0.66. At this phase, the development trend of the CCDs between different cities has diverged. The CCDs of Guangzhou, Shenzhen. Dongguan and Jiangmen continued to rise trend, but the rest of the cities saw varying degrees of decline in their CCD, Zhongshan had the greatest degree of decline in its CCD. For 2018-2022, the average value of the CCDs has shown again trending upward, with the average value eventually rising to 0.85 in 2022. The CCD in each of the nine cities has once again shown an upward trend, but at this time, the degree of coupling varies greatly between different cities. The difference in CCD between Dongguan, the city with the highest CCD of the two industries, and Zhongshan, the city with the lowest CCD of the two industries, was 0.27 in 2022. It can be seen that 9 cities in the PRD have shown an obvious upward trend in the past 15 years, and notable achievements have been made in the synergistic development of manufacturing and logistics.
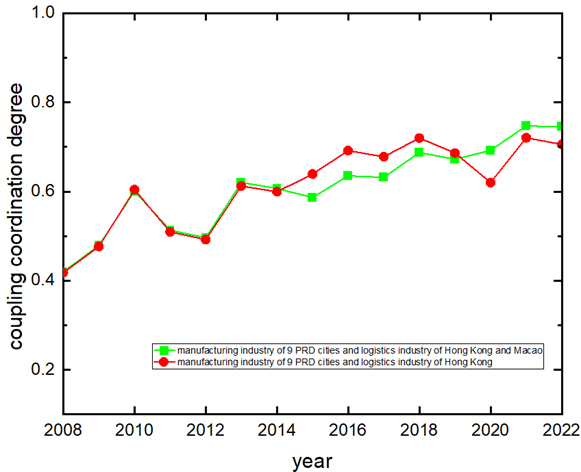
For 2008-2012, the trend of the CCDs between the two has shown in line with each other. After that period, the trend of the CCDs of the two diverged, and the trend of the CCDs between the manufacturing industry of the 9 cities in the PRD and Hong Kong’s logistics industry fluctuated a lot.
The CCDs of the two were continuously high in 2008-2010, both of them exceeding 0.6 in 2010, hitting a stage high. The CCDs of the two subsequently took a sharp turn for the worse. The CCDs of the two oscillated downward from 2010 to 2012, and fell to a stage low in 2012, with the CCD between the manufacturing industry of the cities in the PRD and the logistics industry in Hong Kong and Macau at 0.5; and the CCD between the manufacturing industry of the cities in the PRD and the logistics industry in Hong Kong at 0.49. The trends of the two have also diverged from this year.

Figure 3 shows the CCDs from 2008 to 2022. As shown in the figure, the value of the CCDs generally shows an oscillating upward growth trend.
In 2015, the CCD between the manufacturing industry of the cities in the PRD and the logistics industry in Hong Kong exceeded the CCD between the manufacturing industry of the cities in the PRD and the logistics industry in Hong Kong and Macau for the first time. Until 2020, the value of the manufacturing industry of the cities in the PRD and logistics industry in Hong Kong and Macau once again surpassed the value of the manufacturing industry of the cities in the PRD and the logistics industry in Hong Kong and remained so until 2022. As of 2022, the CCDs of both were above 0.70.
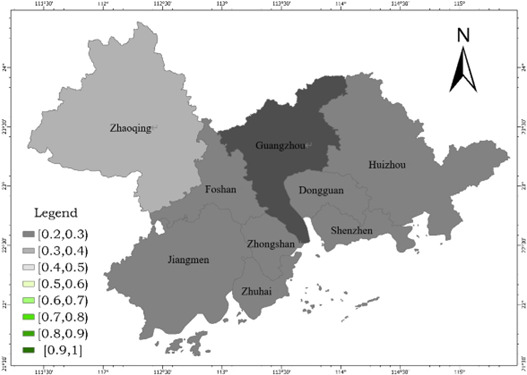
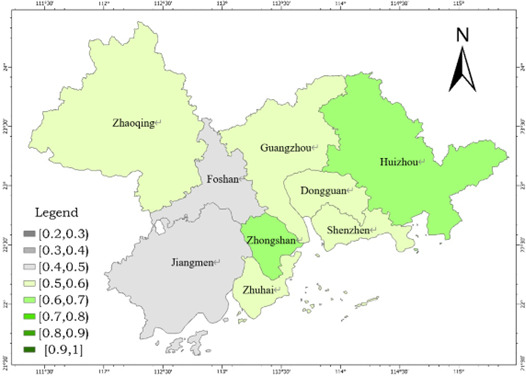


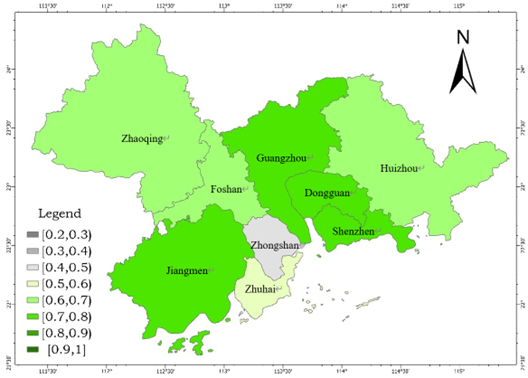
To better describe the spatial evolution pattern of cities in the PRD from 2008 to 2022, ArcGIS Pro was used to draw the spatial distribution of the CCDs between the logistics industry and the manufacturing industry of cities in the PRD in 2008, 2013, 2018, and 2022, as a representative of the change of CCDs of cities in the PRD. See (a)–(d) in Fig. 4 for details.
Influenced by economic development, industrial linkage development, and policy drive, the CCDs of high-quality development of the logistics industry and modern manufacturing industry in all the nine PRD cities in the past 15 years has changed from more low-value and fewer high-value to fewer low-value and more high-value. The characteristics of spatial evolution were obvious. The CCDs of cities in the GBA showed a spatial evolution characteristic of increasing from north to south and from west to east.
In 2008, the city with the highest CCD was Zhaoqing, with the coupling coordination degree level in the mild maladjustment recession. The city with the worst CCD was Guangzhou, with the coupling coordination degree level in the moderate maladjustment recession. The levels of the rest cities were moderate maladjustment recession. At that time, the synergistic development of the two industries in GBA was relatively balanced, and the CCDs of various cities did not show obvious spatial differentiation. Until 2022, the cities with the highest coupling coordination degree level were Shenzhen, Dongguan, and Jiangmen, which have reached high-quality coordinated development. The city with the worst coupling coordination degree level was Zhongshan, which has only reached the primary coordinated development. It was easy to notice that the three cities with the highest coupling coordination degree levels in 2022 were located in the southern part of the GBA, showing the south was stronger than the north. In 2022, the CCDs of the three cities on the east bank of the Pearl River, Shenzhen, Dongguan, and Huizhou, were 0.92, 0.94, and 0.84, respectively, while the CCDs of the three cities on the west bank of the Pearl River, Zhongshan, Zhuhai and Jiangmen, were 0.67, 0.86 and 0.92, respectively. The difference in the CCDs of the cities on both sides of the river was obvious, with the cities on the east bank of the river having a higher degree of coupling coordination. The coupling coordination degree level showed a more pronounced regional imbalance among the cities in the Greater Bay Area.
It is worth mentioning that the growth rate of the average value of the CCDs of the cities on the east coast was relatively consistent. However, the growth rate of the average value of the CCDs of the cities on the west coast varies, and the coupling coordination levels of the three cities generally showed a stepwise distribution.
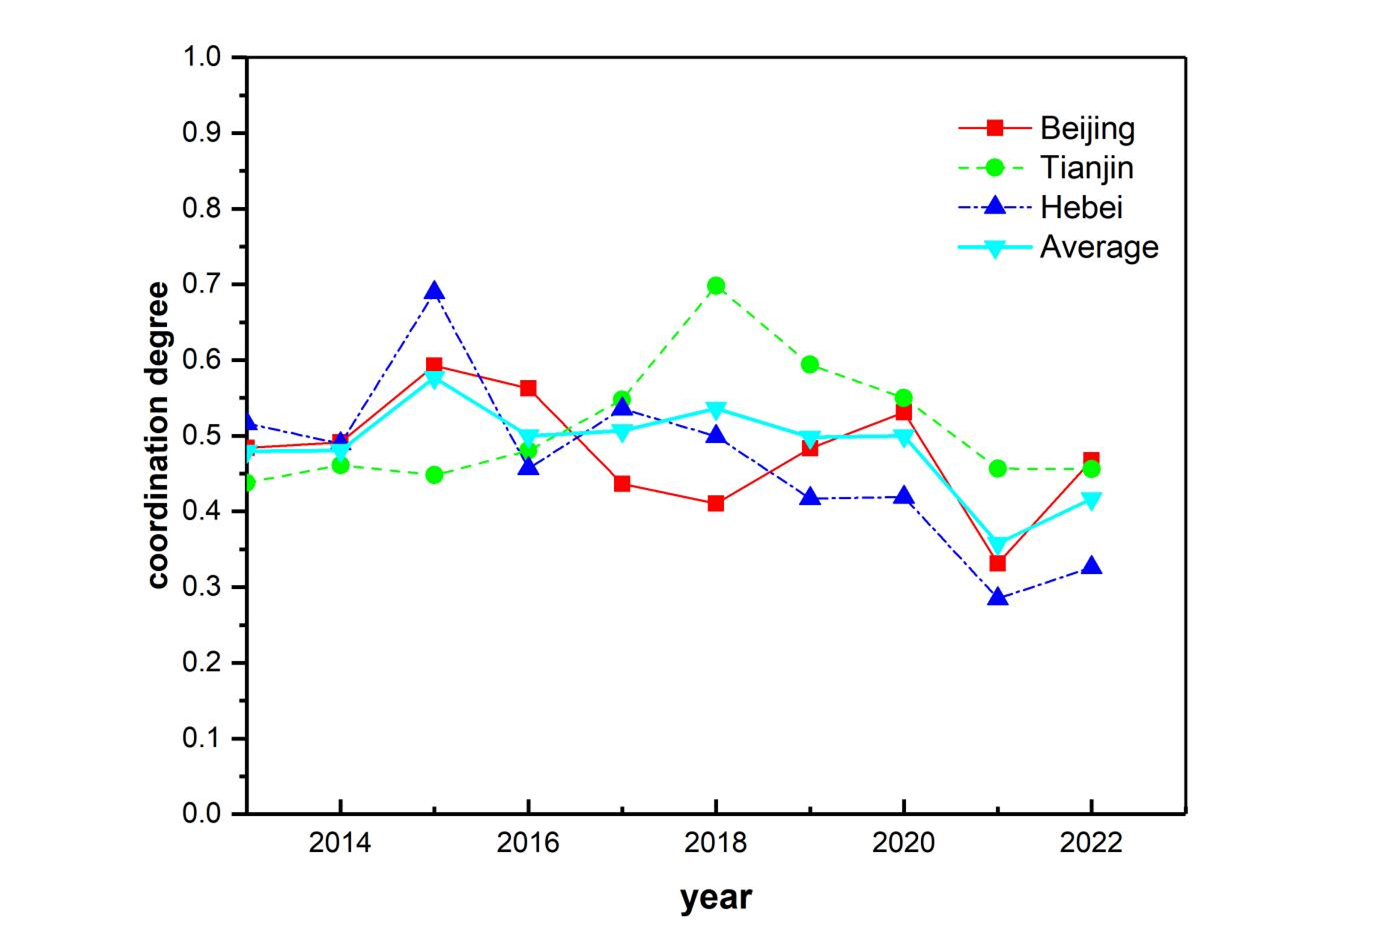
4.3. comparative analysis
The Guangdong-Hong Kong-Macao Greater Bay Area, the Yangtze River Delta, and the Beijing-Tianjin-Hebei region are the three major economic zones in China. In 2023, the GDP of the Beijing-Tianjin-Hebei region reached 10.4 trillion yuan, accounting for 8.25% of the national GDP. The 2014 government work report on the development of the Beijing-Tianjin-Hebei region highlighted the importance of achieving coordinated development in the area.Based on data availability, this paper will select data from 2013 to 2022 to analyze the evolution of high-quality development synergy between the manufacturing and logistics industries in the Beijing-Tianjin-Hebei region, and conduct a comparative analysis with the Guangdong-Hong Kong-Macao region.From the analysis results, it can be seen that the level of industrial synergy in the Beijing-Tianjin-Hebei region is in a state of near maladjustment recession, which is generally lower than the level of synergy in the Guangdong-Hong Kong-Macao Greater Bay Area.From the analysis results, it can be observed that the level of industrial synergy in the Beijing-Tianjin-Hebei region is in a state of near maladjustment recession, which is generally lower than the level of synergy in the Guangdong-Hong Kong-Macao Greater Bay Area. Specifically, the level of high-quality development synergy between the two industries gradually increased from 2013 to 2018 but began to decline after 2019. Additionally, the level of synergy between the two industries across provinces is lower than that within provinces, as detailed in Figures 5 and 6.


4.4. mechanism analysis
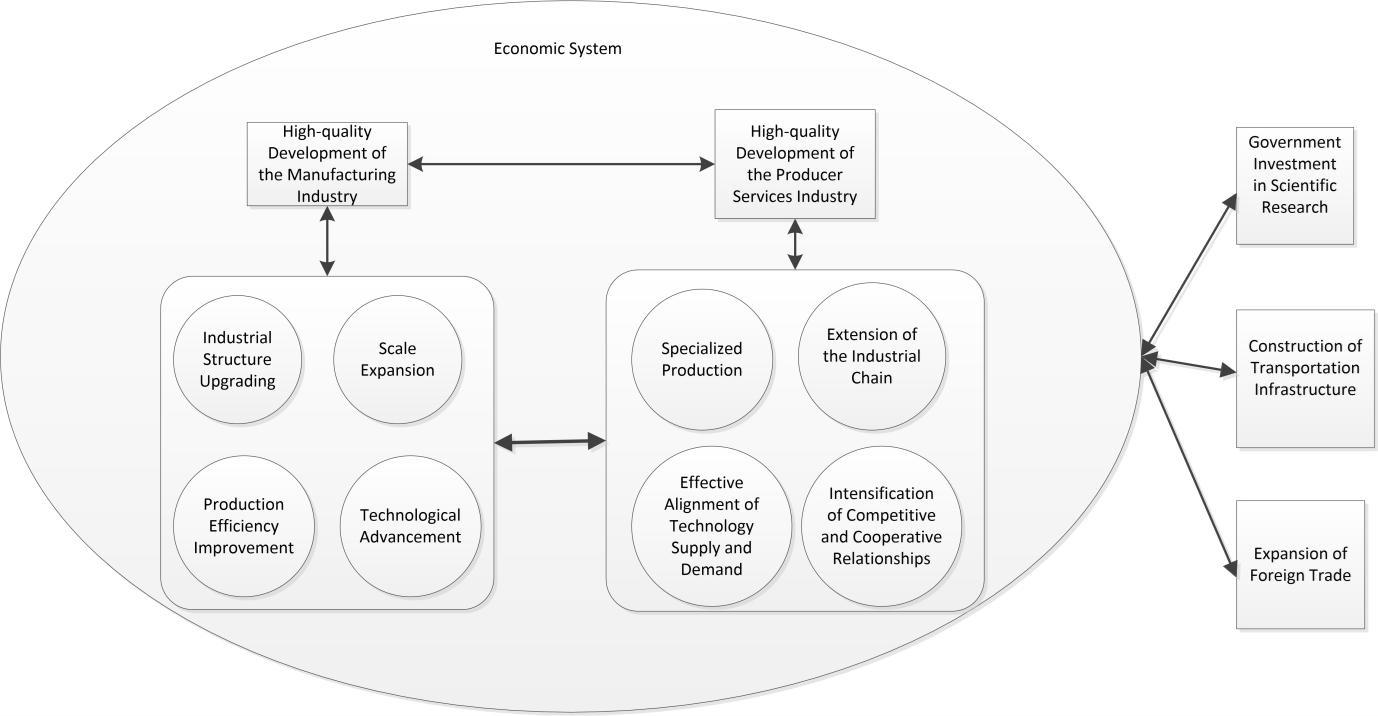
Based on the principles of industrial economics, spatial economics, and policy economics, this study utilizes the system dynamics method to analyze the synergistic evolution mechanism between the manufacturing and producer services industries in the Guangdong-Hong Kong-Macao Greater Bay Area.
From an internal industry perspective, the high-quality development of the manufacturing sector leads to the expansion of economic scale, upgrading of economic structures, improvement of production efficiency, and technological innovation. This results in intra-industry division of labor, further extension of industrial chains, and specialized regional production, thereby increasing the demand for local, regional, and international producer services. This promotes industrial cooperation and competition, fosters effective matching between technological innovation and demand, and ultimately drives the high-quality development of producer services. Conversely, the high-quality development of producer services actively seeks industrial cooperation and demand, strengthens regional industrial division of labor, and thereby supports the high-quality development of the manufacturing sector.
From an external industry perspective, increased investment in infrastructure reduces business costs within and between regions, leading to the reallocation of production factor resources across regions and industries. According to the principles of spatial economics, due to the relative existence of agglomeration economies and congestion costs, industries will agglomerate when the centripetal forces of agglomeration outweigh the centrifugal forces of dispersion. Conversely, industries will transition from agglomeration to dispersion. This dynamic of agglomeration and dispersion drives the flow of production factors within regions and across industries, promoting industrial structural upgrading. Increased government spending on research fosters industrial technological revolutions, advances the high-quality development of producer services, and further enhances their ability to better serve the manufacturing sector. Therefore, the framework of the industrial synergistic evolution mechanism can be illustrated as shown in Figure 7.

Conclusions
Based on the evaluation index system for high-quality development of the modern manufacturing industry of cities in the PRD, evaluation index system for logistics industry development of cities in the PRD, and evaluation index system for logistics industry development in Hong Kong and Macau, the comprehensive index of manufacturing of cities in the PRD and the CCDs of coupling coordination models were respectively measured in this study. The main conclusions are as follows:
-
The comprehensive index of manufacturing has shown an upward trend in the past 15 years, indicating that the improvement in the level of high-quality development has been effective.
-
The CCDs of different coupling coordination models have shown an overall upward trend from 2008 to 2022. In 2022, the CCDs of different coupling coordination models were all at a high level.
-
The CCDs of high-quality development of the logistics industry and modern manufacturing industry of cities in the PRD features obvious regional heterogeneity, which is indicated by the fact that the CCDs of the eastern regions were greater than that of the western regions, while that of the southern regions were higher than that of the north regions.
Furthermore, analyze the impact mechanisms of the synergistic development between the two industries. Based on these findings, several policy suggestion were provided for the synergistic industrial development of the Guangdong-Hong Kong-Macao Greater Bay Area. Details were as follows:
-
Increase investment in scientific research, carry out technological innovation in clusters, and form the scale effect of demand for producer services.
-
Promote regional integration, upgrade the level of factors, and improve regional production efficiency. Governments and non-profit organizations spontaneously provide producer services to enterprises, strengthen the connections between different industries, promote horizontal and vertical extension of industries, and enhance the level and quality of industrial synergy.
-
Expand the economic scale, form intra-industry division of labor and extension of the industrial chain, and increase the demand for producer services.
-
Optimize the economic structure, form large-scale technology-intensive and capital-intensive industrial clusters, increase investment in technology, information, cloud computing, and scientific research capital, and promote quality, efficiency, and dynamic transformations in economic development.
-
Expand foreign trade, “go global” and “bring in” to participate in global supply chain division of labor, promote high-quality synergy between the two industries, and enhance their competitiveness.
-
Increase investment in transportation infrastructure, improve connectivity within the Greater Bay Area, reduce transportation and business costs, enhance the flow of production factors between regions, and improve inter-regional industrial synergy.
These analyses are believed to be helpful to the government in further planning for the GBA. Finally, there are a few limitations that should be improved in future research. Due to the limitations of data availability, this study inevitably has limitations that need to categorize the CCDs of logistics and modern manufacturing industries in the GBA into three coupling coordination models to be calculated. Besides, this study only described the CCD and conducted the theoretical analysis of the impact mechanisms between the logistics industry and the modern manufacturing industry in the GBA but empirical analysis wasn’t conducted.
Funding
We gratefully acknowledge financial support from Humanities and Social Sciences Youth Program of Ministry of Education, Research on the Synergistic Evolution Mechanism and Path of High-Quality Development of China’s Productive Service Industry and Manufacturing Industry " (No.21Y1C790058), Philosophy and Social Science Program of Guangdong Province “Study on the Synergistic Evolution Mechanism of High-Quality Development of Productive Service industry and Manufacturing Industry in Guangdong. Hong Kong and Macao Greater Bay Area”.No.GD200YJ15). Guangdong Provincial Social Science Co-construction Project “Research on the Path of Coordinated Development of Supply Chain and Innovation Chain of Automobile Industry in Guangdong Province” (No.GD23XGL013).